One-Click Performance Analysis Inside Business Central

Let me start with a confession: I almost never profile my Business Central code. Not because I don’t care about performance, but because the whole process is just painful enough that I keep putting it off. I run the profiler maybe once every 3.14 full moons, usually when someone is already reporting that things feel slow. By then, the problems have been baking in for weeks.
I don’t think I’m alone in this.
BC’s built-in Performance Profiler is honestly pretty good. It gives you app breakdowns, time-by-object tables, and a full call tree. You can see where time is being spent.
But that’s where it stops. It tells you the “where,” not the “why” or the “what now.” You’re left staring at a call tree thinking “okay, Sales-Post took 1.5 seconds… is that bad? What’s causing it?”
Interpreting a profile still takes experience and patience, and even then you might miss the subtle stuff: an unfiltered FindSet, a CalcFields buried inside a loop, an event subscriber quietly eating time on every transaction.
So I built something to close that gap: a BC extension that puts an “Analyze with AL Perf” button directly on the Performance Profiler page.
What it does
You record a profiling session the way you normally would: start, reproduce the scenario, stop. Then instead of downloading the file and context-switching to another tool, you click one button. A few seconds later (20-30 seconds), the analysis shows up right there on the page, inside Business Central.
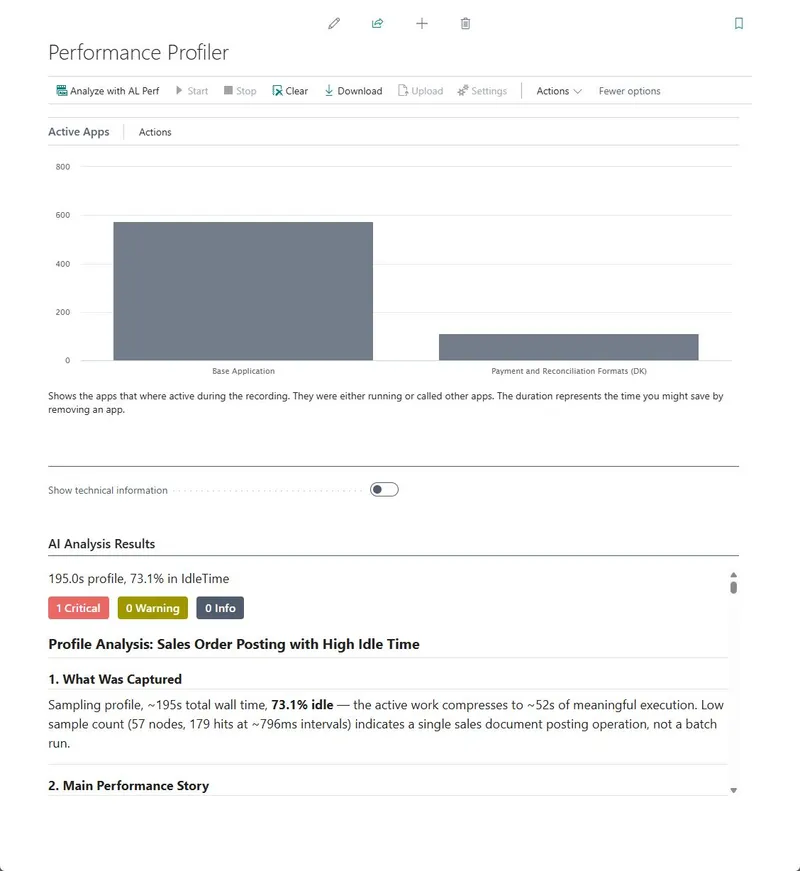
No file exports. No browser tabs. No manual interpretation.
You get:
- Top hotspots ranked by self-time and total-time, broken down by app and object
- Detected patterns: the analyzer flags known performance anti-patterns like single method dominance, repeated sibling calls (think N+1), event subscriber hotspots, deep call stacks, and more. Each comes with a severity level and a concrete suggestion
- App and object breakdowns showing where time is actually going
- AI-powered explanation: the structured analysis gets fed to Claude, which produces a plain-English summary of what’s going on, what matters most, and where to start. It’s a shortcut to understanding the profile, not a replacement for your own judgment, but it gets you to the right questions faster
Feed it a profile from a Sales Quotes page and it tells you that 54% of time is metadata loading, not business logic, that Business Events is the amplifier, and that Available to Promise is running 17 SUM aggregations per line. Five root causes, ranked by impact, in 20 seconds.
How it works
When you click “Analyze with AL Perf,” the extension grabs the profile data straight from BC’s sampling profiler, the same data the Performance Profiler page already has in memory. It packages that into an HTTP request and sends it to the AL Perf Analyzer service.
On the other end, the profile gets parsed, the call tree gets rebuilt, and a set of pattern detectors go to work looking for common BC performance problems.
There are two levels of analysis. From the profile alone, the analyzer can detect things like single method dominance, repeated sibling calls that suggest N+1 patterns, event subscriber hotspots, and deep call stacks. That’s already more than you’d catch by eyeballing a call tree.
But the real depth comes when you add your AL source code. The profile can tell you that FindSet was called 50 times under one parent, but it can’t tell you why. Is it called from a loop? Or from 50 different code paths?
With the source code, the analyzer can prove the syntactic nesting: yes, that FindSet is inside a repeat..until, and that’s your N+1 query. It can also catch things the profile has zero visibility into, like a FindSet with no SetLoadFields, or an unfiltered record operation that happens to be fast today because the table only has 10 rows but will be catastrophic when a customer has 100,000.
The AI layer then takes all of those structured findings and turns them into something you can hand to a colleague or paste into a work item.
You probably use the in-client Performance Profiler most of the time. So do I. It’s convenient and it’s right there. But it only gives you the .alcpuprofile with no source attached, which means you’re limited to the profile-only patterns.
If you want the full picture, the VS Code path is worth the extra step. When you use “AL: Generate profile file,” you get both the .alcpuprofile and a snapshot .zip with your AL source embedded. Upload both to the web app and the analyzer can prove the nesting, flag the missing SetLoadFields, and catch the unfiltered queries that aren’t slow yet but will be.
It’s the difference between “method X took a lot of time” and “method X calls FindSet inside a loop on an unfiltered table with no SetLoadFields.”
The web app at alperf.sshadows.dk is the same analysis engine with a different front end. The BC extension gives you profile-only analysis for the quick, zero-friction path. The web app gives you the full experience with source correlation when you have the snapshot .zip.
Try it
The extension is open source: github.com/SShadowS/al-perf-bc
Install it, record a profiling session, click the button. That’s the whole setup.
If you don’t want to install an extension, the web app at alperf.sshadows.dk works the same way. Drag and drop your .alcpuprofile and get an instant analysis.
Your profile is transmitted over HTTPS, analyzed in memory, and discarded immediately. Nothing is stored on the server. If your organization has data governance requirements that prevent sending profiling data externally, the analyzer can be self-hosted as soon as I think of a way to make it easy.
I built this because I got tired of staring at call trees and guessing. If it saves you even one afternoon of manual profiling archaeology, it was worth it.
What’s next
Since this post, the analyzer has grown into a CLI tool, an MCP server, and a library you can import directly. The CLI plugs into CI/CD pipelines, and the MCP server lets AI coding agents work with profiles. The full source is on GitHub.
But the immediate win is simpler than all of that: make profiling a habit instead of a last resort. When the analysis is one click away and the results are immediately actionable, you stop putting it off. That’s the whole point.